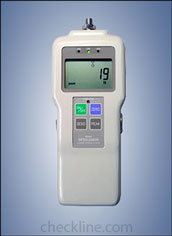
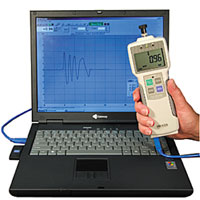
ZPH digital force gauges are capable of processing 1,000 data/second, so force profiles can be analyzed for much more than just the peak. Collect peak data on your computer with the USB cable and ZP Logger (included) or 1,000 data/second with ZP Recorder (optional).
Main Features ZPH gauges have programmable high/low setpoints for go/no-go testing. Orange lights up for measurements less than Low setpoint, green for between High and Low setpoint, and red for over High setpoint.
Use real time mode to display load transients, or peak mode to capture the peak force achieved during a test. Selectable lbf, kgf, or Newtons measuring units.
Store up to 1,000 values in memory and download to your computer using USB or RS-232C output.
- Supplied with NIST Calibration certificate
- 2 Year Warranty
- Heavy duty metal construction
- "Zero Set" to zero the gauge in all operating positions (Tare)
- Operates on internal Ni-MH batteries or AC adapter
- Overload protection 200 % full scale
-
Selectable Modes
Real Time (to display load transients)
Peak Modes (to capture the peak force achieved during a test) - ISO/IEC 17025 Long-form Certificate & Test Data is optionally available
- For hand-held use or mounting on test stands
- USB, RS-232C, and Analog outputs
- Quick display update rate of 20 times/s
- User selectable units: N, kgf (gf) and lb (oz)
- Process 1,000 data/second not just the peak
- Reversible Display allows for easy reading during inverted use
| Model | Capacity | Resolution |
|---|---|---|
| ZPH-440 | 440 lb 200 Kg 2000 N | 0.1 lb 0.1 kg 1 N |
| ZPH-1100 | 1100 lb 500 Kg 5000 N | 1 lb 0.1 kb 1 N |
ZP Logger is a USB software utility that logs force values by pressing the Send button on the gauge, from either Peak or Real time modes. ZP Logger also downloads all values previously stored in gauge memory and saves in CSV format.
ZP Recorder Software (optional)
ZP Recorder is force data analysis software designed to interface with our ZPH Series (USB) force gauges. ZP Recorder records and processes 1,000 data per second (not just the peak) and generates a graph with statistics. Zoom into any part of the graph to see individual data points at intervals of 1mS. Mouse over data points to display their force value.
Further analysis can be done on the entire range or by selecting part of the graph to detect the first peak or generate statistics within that time interval. Compare and align multiple graphs. Save graphs or export data to CSV format.

| Displacement | 0.2 mm |
| Accuracy: | ± 0.2% Full scale ± 1 digit |
| Selectable units | Pounds, Kilograms or Newtons |
| Display: | 4 digit, 12 mm high |
| Overload capacity: | 200% Full scale, display flashes beyond 108% full scale |
| Zero adjustment (Tare) | 10% Full scale |
| A/D Converter: | 14 bit |
| Outputs | USB, RS-232 and ± 2 VDC analog output |
| Displacement at full scale capacity | 0.10 mm |
| Temperature range: | 0 - 40°C |
| Air humidity: | 85% RH, max. |
| Low battery indicator: | Display flashes when battery is low |
| Power supply: | Rechargeable Ni-MH battery pack and/or 230 AC Adapter |
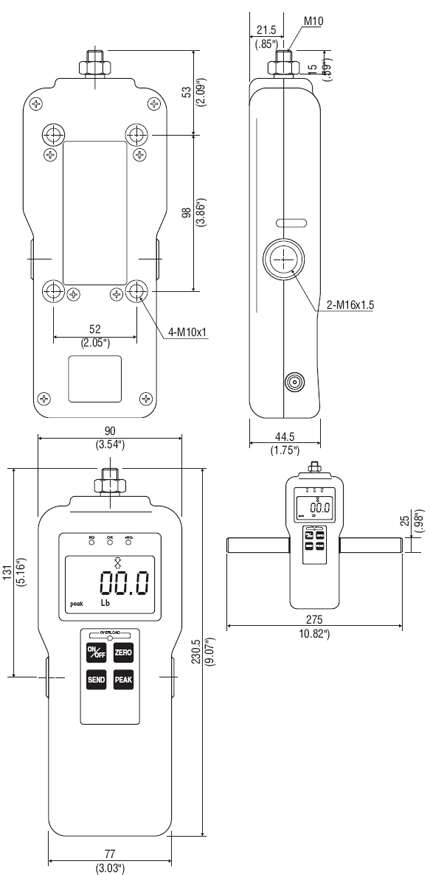
| Housing dimension: | 215 x 65 x 51 mm (L x W x H) |
| Weight, net (gross) | approx. 430 g (1300 g) |
| Warranty | 2 Years |


